Data Identification And Collection
In this assignment you will use the skills learned from the lectures on Google Searching, Google Analytics, and Google Search Trends, and Google Forms to do data identification and collection. Place all answers and screenshots in a Google Document. The steps below will tell you what to put in the assignment document. Put the question number from the assignment leading all entries in the assignment document.
Part 1: Data Collection - Google Search Engine
Use Google's Advanced Search Page to find data and sources relevant to your project topic on exploring the impact of a computing innovation. Use at least two of the advanced criteria for each search. The yielded advanced search string will appear in the search box on the results page.
Place in your assignment document (label with A-F as listed here) The URL of the result you picked, AND the Google search string yielded from the advanced search (copied from the search box and pasted into your document) and a screenshot showing the search string and results page (show at least the first 3 results) - do this for each of the 6 searches described below:
- Perform 3 individual searches to find 3 different sources to use for your project research.
- One wikipedia article.
- One scholarly article.
- One news article.
At least two of the sources must be published after the last academic year ended.
- Perform 3 individual searches to find 3 relevant data items to use for your project website.
- A graph or chart analyzing data.
- A video.
- An image.
- Here are some Advanced Search Tips that may be useful for this step of the assignment.
Place in your assign document: G. In your document describe in your own words the data on which Google Search works and how that data was collected.
Part 2: Data Collection - Google Analytics
Follow these instructions to add Google Analytics to the Google Site that you created in a previous assignment.
Place in your assignment document:
- A screenshot of the Google Analytics dashboard showing at least 1 active visitor (using the Real-Time feature).
- The URL of your main Google Site
- Explain in a few sentences where does Google Analytics get its data from?
Part 3: Data Collection - Google Forms Survey
Use Google Forms to take a survey of at least 20 people, asking about the impact of computing as it relates to your project topic.
- Follow this tutorial on how to Create a form from your Drive.
- Give the Form a Title.
- Set the form access to "Any one who has the link can access it" or "Public", do not set it to "Private". To do this, after your form is saved on your Google Drive, right click it and choose "Sharing". You set its access level in the resulting dialog box.
- Create questions following these guidelines, where TOPIC is your project topic. Create the question type exactly as specified. Note that how to answer some of these questions is left intentionally vague so that we can use the data collect as a candidate for filtering and cleaning in a later lesson.
- How old are you? [short answer]
- Gender [multiple choice male, female, prefer not to answer, other]
- Before taking this survey, have you heard of TOPIC [multiple choice - you provide the choices]
- On a scale of 1 (low impact) to 5 (high impact) how much impact do you think TOPIC has had on society in general? [linear scale 1-5]
- On a scale of 1 (low impact) to 5 (high impact) how much impact do you think TOPIC has had on your life? [linear scale 1-5]
- In ten words or less, how has TOPIC impacted your life? [short answer]
You must ask the above questions. You may also add other questions if you wish (but not too many, you don't want to make the survey be a burden on people).
- Use the Insert menu of Google Sites editor to embed the form on your Google Site that you made in a previous assignment. Put the form on the Google site page that you created about the impact (the page with the video). Also include on the page text explaining the survey.
- Send the form to at least 20 people. Be sure to collect at least 20 responses by the time the next assignment is due (not this current assignment, the next assignment). Your instructor may have you collect responses from your classmates, check with him/her. However, try to get other people of different ages to take your survey too so that your results have varying ages of people represented. You will collect and analyze the results in the next assignment.
Place in your assignment document:
- The URL of your Google Sites page with your survey embedded.
*Part 4: Data Visualization and Analysis - Google Search Trends
When you post information to a social network, watch a video online, or simply search for information on a search engine, some of that data is collected, and you reveal what topics are currently on your mind. When a topic is quickly growing in popularity, it is often said to be trending, but there are many different trends or patterns we might find in this data, including historical trends. These patterns might help us to identify, understand, and predict how our world is changing.
You will be using Google Trends , which is a tool that allows you to visualize data about search history across different times and locations. You will be looking for interesting patterns, trends, or relationships between multiple trends and try to tell the story that pattern is showing. For instance, this figure shows comparing the search trends for streaming, mp3, and cd. 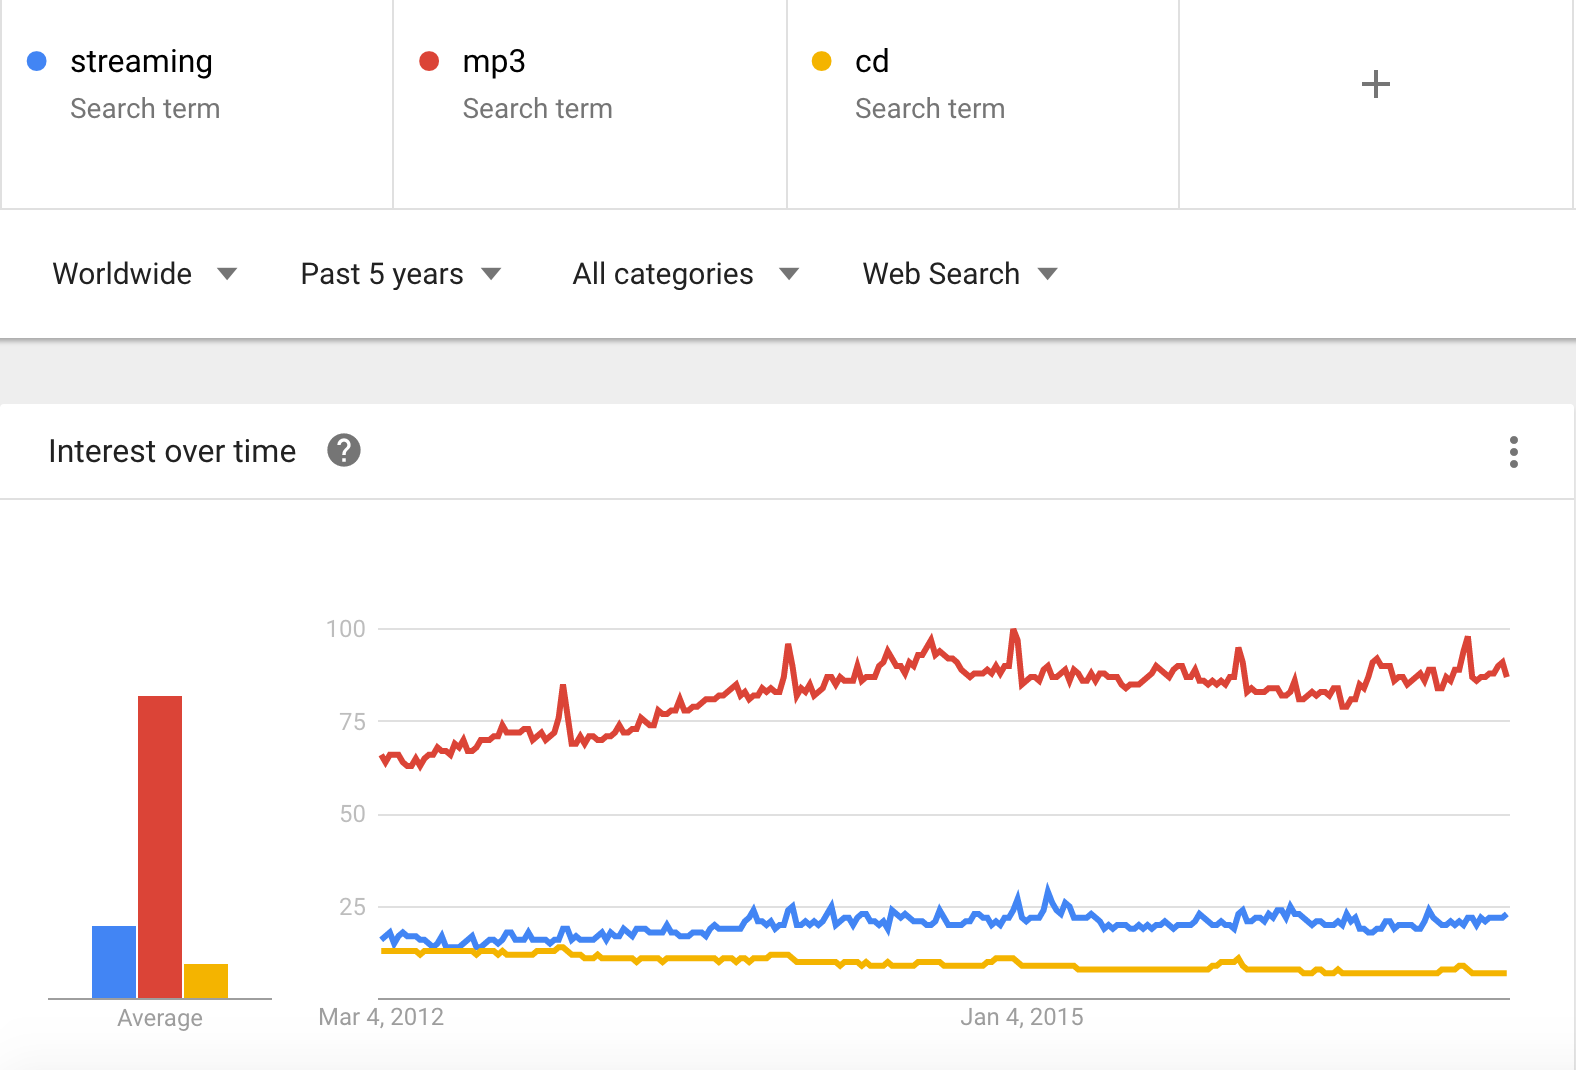
In your own words answer these questions in your assignment document:
- Where does Google Trends data come from?
- How is Google Trends data adjusted? What does a value of 100 mean?
Using your course project topic as a search term (or several related to your topic), look for:
- Long-term trends: Is your topic becoming more popular over time? Less?
- Short-term trends: Does your topic suddenly spike or dip in popularity?
- Patterns: Does your topic follow some predictable repeated pattern?
- Relationships: Does one topic increase or decrease in popularity when another one does?
- Zoom-in: You can narrow your search to particular regions, times, and categories
Answer these questions in your assignment document:
- Describe what terms you compared and whether you narrowed your search by using filters.
- Paste in screen shots of the charts and visualizations supplied by Google Trends for the terms you just searched. Accurately describe what the charts or other visualizations are showing.
- Come up with a possible story or explanation of why the trend you described might have happened.
Part 5: Data Visualization And Analysis - Google Analytics
For this question, you will be using this sample Google Analytics report (PDF).
Watch the videos in this weeks lesson to help answer the questions below. In addition to watching the videos, you are encouraged to perform web searches to help answer the questions, just be sure to use your own words to demonstrate understanding - do not copy and paste.
Google Analytics provides many ways to visualize the data that you described in Part 2 above. Below are some visualizations.
- Audience:
- Discuss how the company could use the location data gathered from the report to affect the design of its website. Provide an example.
- Content Tracking:
- In the sample report, what percentage of the page visits went to:
- The main page (called index.php)
- The photos page
- The students page
- The events page
- The alumni page
- Discuss how the company could use content tracking data to affect the design of its website. Provide an example.
- Traffic Sources:
- List the search traffic keyword values from the sample report.
- Discuss how the company could use the search traffic keyword data to affect the design of its website. Provide an example.
* Wording, concepts, and materials for parts of this assignment marked with * were taken from educational material provided by code.org under the Creative Commons Attribution-NonCommercial-ShareAlike 4.0 Unported License>
.